This week I gave a presentation in my son’s classroom about all of the sugar that is lurking in five popular beverages. It was just as enlightening for me and the teachers as it was for the students. Since this topic is equally relevant for people with chronic health conditions like prediabetes and diabetes, I thought it might be helpful to also share the information here. So give it a read, find out which drink has the most sugar, and leave a comment letting me know if anything surprised you!
(Pin this post to read later)
The process: an overview
In order to answer the question “which drink has the most sugar?”, I followed a process based on the Sugar Measuring Activity in the book Sugarproof. (1) Here’s the overall structure of this activity, so you can replicate it at home using your own beverages if you would like:
- Grab your beverage container of choice
- Find Total Sugars on the food label
- Note the Total Sugars per serving for that product (and per container too, if you commonly drink the entire can or bottle at once)
- Divide the grams of Total Sugar by 4 to get the number of teaspoons per serving
- Grab a bag of sugar and measure out that number of teaspoons into a clear drinking glass
- Take a moment to consider – would you ever eat that much sugar with a spoon? (My guess is no!) Use that knowledge the next time you are making a beverage choice.
You can do this activity with food items in addition to beverages.
Which drink has the most sugar? Step 1 – grab your beverage container of choice
To prep for doing this activity at my son’s school, I went to the grocery store and bought five drinks that seemed like popular choices. Here’s the breakdown, along with the reasons why I choose them.
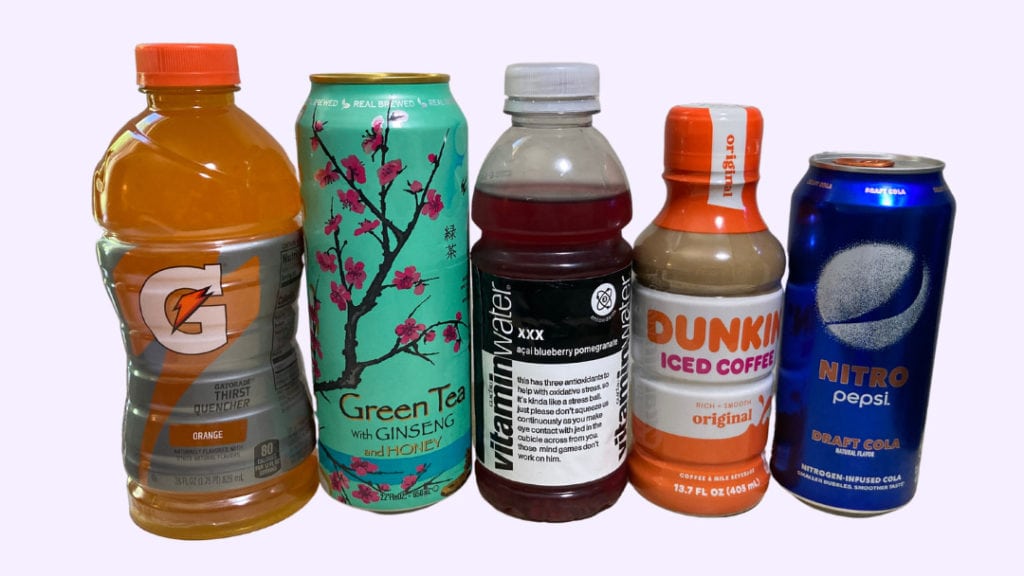
- Pepsi Nitro – I wanted to choose a soda, and with the word “Nitro” on the label, it seemed like it might be an extreme version
- Dunkin’ Iced Coffee Original – coffee drinks are very popular, and a lot of people don’t realize how much sugar they contain
- Arizona Green Tea with Ginseng and Honey – because “green tea with ginseng and honey” sounds healthier – but is it really?
- Gatorade Orange – sports drinks are prevalent, but they are also a big source of sugar
- Vitamin Water XXX Acai Blueberry Pomegranate – this brand seems to present itself as a healthier version of a sports drink, so I thought it would be an interesting comparison
Step 2 – find Total Sugars on the food label
After gathering all the beverages, the next step I took was to read the Nutrition Facts Label to determine the amount of sugar in each product. For the purposes of this activity, I focused on the Total Sugars. That’s because the amount of Total Sugars and Added Sugars were identical for every product except the Dunkin’ Iced Coffee. (If you want to learn more about label reading and the difference between Total Sugars and Added Sugars, check out my blog post on identifying foods with no added sugar.)
Step 3 – note the Total Sugars per serving for that product
Here’s what that breakdown looked like:
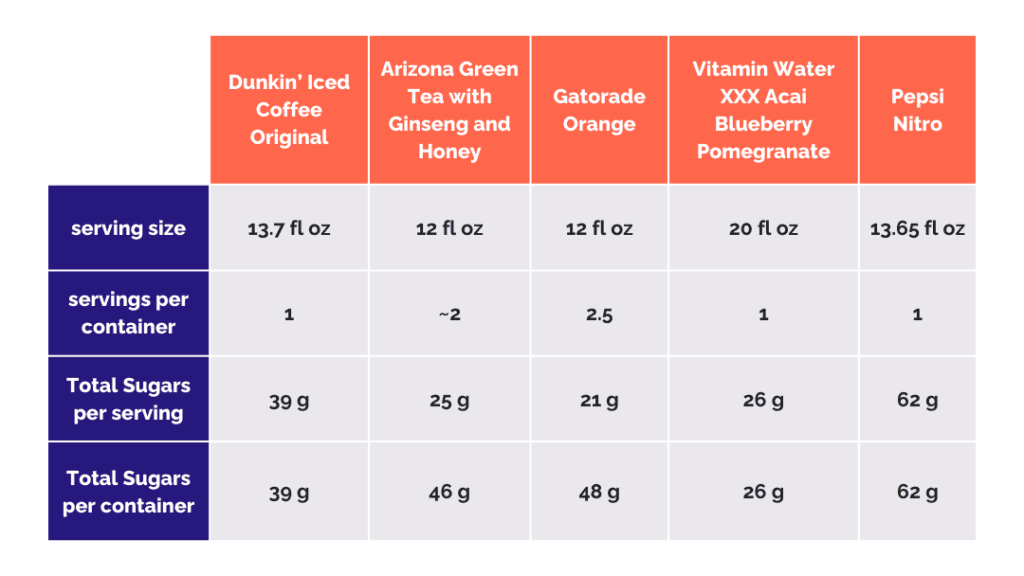
As you can see, Pepsi Nitro wins this contest hands down. It has almost triple the sugar per serving of Gatorade Orange, and more than double the sugar of the Arizona Green Tea and Vitamin Water.
A quick word about the Dunkin’ Iced Coffee; it has the second-highest amount of Total Sugar per serving. But here I will point out the difference between Total Sugars and Added Sugars. Because of the lactose contained in milk, which is an ingredient in this product, the Dunkin’ Iced Coffee only has 28 g of Added Sugar (11 g of sugar comes from the milk itself). That’s still more sugar than three out of the five beverages, but it’s still less than half what the Pepsi contains.
Step 4 – divide the grams of Total Sugar by 4 to get the number of teaspoons per serving
After compiling the above information, I wanted to translate it into something a little more tangible for the average person (because most of us don’t think of quantities of food in terms of grams). So the next step I took was to convert the grams of sugar from the chart above into teaspoons. Because there are 4 grams of sugar in 1 teaspoon, all you have to do is divide Total Sugars by 4 to figure this out (1):

Step 5 – measure out that number of teaspoons into a clear drinking glass
Okay, since this is a blog post, I’m not going to be able to do this step with you. So instead, I’m going to give you a bit more information about these beverages.
The above example shows you a comparison of the sugar contained in one serving of each of the aforementioned products. However, you probably noticed that several of these drinks have different serving sizes. So in order to make this comparison more even, here’s how much Total Sugar and teaspoons of sugar are contained in 12 ounces of each beverage:

Comparing the drinks in this way, the Vitamin Water actually contains the least amount of sugar, with Gatorade Orange being the next best. Of course, whichever way you look at it, the Pepsi Nitro still has the most.
So, in answer to the question “which drink has the most sugar?” – it looks like the Pepsi Nitro is the winner.
Step 6 – reflect on the amount of sugar in these beverages when making future choices
While this was a fun activity for me to do with a class of third graders, how does knowing which drink has the most sugar apply to your life? Here’s a few take home messages for you:
- Before you consume any canned, bottled, or otherwise packaged beverage, check the label for Total Sugars and Added Sugars. It’s important to educate yourself about what you are drinking.
- Be sure to check the Serving Size too, since some canned/bottled products have more than one serving per container.
- Just because a beverage appears “healthier,” that doesn’t mean you shouldn’t check the label. Seemingly “healthier” products like Gatorade, Vitamin Water, or tea sweetened with honey can still pack a punch when it comes to sugar.
- Non-diet sodas are considered fast-acting sources of sugar by the CDC (2) and should be consumed in moderation (and preferably with another food to slow the release of glucose into the bloodstream).
This is great, but what about juice?
Some of you may have noticed that there were no juices included in the above comparison. That’s because I wanted to focus on more “processed” drinks for this particular activity. I do want to mention that juice also contains a large amount of sugar. Here’s a few examples using products that we sometimes drink in our home:
- Motts 100% Apple Juice – 28 g of sugar per 8 ounces
- Motts for Tots Fruit Punch – 15 g of sugar per 8 ounces (it’s less because this is basically watered-down juice)
- Simply Orange Pulp-Free – 23 g of sugar per 8 ounces – also 100% juice
Even though it comes from fruit, juice is still a very concentrated, fast-acting source of sugar. That’s why it can be used by diabetics to treat low blood sugars – it gives the body an easily absorbable source of glucose. (2) In my opinion, juice should be consumed only in moderation, and I mentally put it in the same category as other sugary beverages.
What to do with this information?
I hope this post has given you some food for thought (no pun intended) about the amounts of sugar contained in some popular beverages. Reading labels for sugar content is a transferrable skill, as is being a sugar-savvy consumer. So use this knowledge in making future choices about what to drink. Also consider if there are any beverages you commonly consume that you could drink less of or switch out for a lower-sugar version.
Feel like you need some help in tweaking your beverage consumption? Reach out using the button below! I’d love to help provide you with some healthier alternatives.
References
- Goran, M.I. and Ventura, E.E. (2020) Sugarproof: the hidden dangers of sugar that are putting your child’s health at risk and what you can do. New York: Avery, an imprint of Penguin Random House.
- How to Treat Low Blood Sugar (Hypoglycemia) (2021) Centers for Disease Control and Prevention. Available at: https://www.cdc.gov/diabetes/basics/low-blood-sugar-treatment.html (Accessed: 15 May 2023).






0 Comments